Sage Intelligence Reporting for Sage 300 Users
In today’s blog article, we are highlighting Sage Intelligence reporting for Sage 300 users. Not only is Sage Intelligence inexpensive (you get 1 license free with your Sage 300 install), it is also fairly easy to use – doesn’t require a lot of technical knowledge to get started (Template Concept and Excel based). Sage Intelligence is a great cost effective, easy to learn reporting / BI solution and a must-see for all Sage 300 clients.
(Note: All Sage 300 users that are on Gold Support or higher get a free Sage Intelligence license with their Sage 300 software. All Sage 300C users also get a free Sage Intelligence license.)
Let’s look at how to create a standard report in Sage Intelligence (in Sage 300):
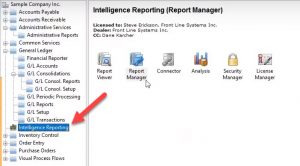
First log into your Sage 300 system, then click on Intelligence Reporting. The first component we will navigate to, is called Report Manager.
 When you come into Report Manager, you will see all the reports that you will have access to, right out of the box. To use any of these reports you will need to create a copy of the report before editing the same. Right click on the report and then select Copy.
For the purposes of this blog article, we will create a report that shows us all our open customer invoices. To get started, navigate to the Toolbar on the top and then click on Add Folder. Enter the name of the Folder (that will house your report) and then click on Add Report. You will then be prompted to select the type of report you want to create (standard/union or cube). Select a standard report and then type in the name of your report.
Data Containers in Sage Intelligence
Next, select the Data Container that makes sense for your report. We are going to pick the Sales Master AR 3-5 (AE-SQL) data container, and click ok. Now you will be able to see all the fields that are available in the container. Pick the fields that you want to include in your report (eg. Customer Name, Customer Number, Document Date, Document Number and Line Sales Amount excl. Tip and Salesperson) and click OK.
Add More Options to Your Sage Intelligence Report
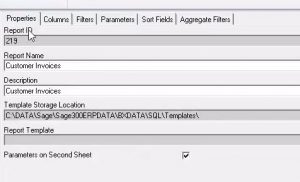
 Now, lets then navigate to the tabs on the right side of the screen. When you click on the Properties tab you will see a few details about the report you just created like – Report ID, Report Name etc. Make sure to click the Show Advanced checkbox on the bottom of the screen. Now navigate to the field that says ‘Allow Report Viewer and External Access’, and check it.
Next, navigate to the Columns tab and reorganize the columns as you see want to see them in your report (by simply using drag and drop), hit Refresh, and then Run.
 Now, let’s look at adding some filters to the report (e.g You only want to see invoices that are open) – Navigate to the Filters tab and then click the Add button. Then select Line Sales Amount excl. TIP, then select Greater Than Or Equal To and then Enter the Comparison Value (0.00).
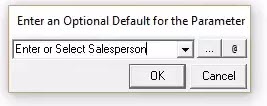
Under the Parameters tab, if you want to be able to view data by a particular sales rep, click add and select Equal to and then type ‘Enter or Select Sales person’ (in the Enter an Optional Default for the Parameter tab). Then select Refresh and then Run the report.
Note: You can select the ellipsis to look up a value or use the @ sign to pick a variable, when selecting parameters for your report.
Sage Intelligence Reporting – Output to Excel
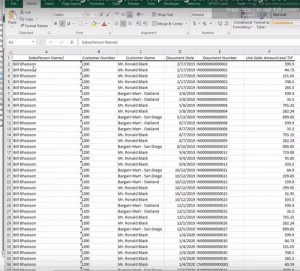
When you run the report, Sage Intelligence will produce a report in Excel. The first sheet in the spreadsheet will include all the data. The second sheet will include all the parameters of the report in the spreadsheet.  To view the data in a way that is easily digestible by your team, we recommend using Pivot tables in Excel.
Here’s how you create a simple Pivot table:
Go the Insert Tab in Excel and then click on the PivotTable icon on the spreadsheet. Next, select the Table Range from Sheet 1 of your report and then select the location where you want to place the PivotTable in the spreadsheet (new or existing worksheet).
You will see the PivotTable fields on the right side of the screen. Select the fields you want to see on the report and format the data until you like the final output of the report. Once you are happy with the way the report looks, hide the spreadsheet tabs that contain the raw data and report parameters.
Next navigate back to the Report Manager in Sage Intelligence and click on the tab that says, ‘Save Excel Template.’ Select Book1. Click Yes when you are prompted to clear the second sheet from the Workbook, choose Excel Template as the Template File format you want to choose, then click Ok.
You’ll be prompted to specify the template name for that report. Enter the template name you prefer for the report and then click ok. Next select Yes to switch off the Save Data with Table Layout option and you will see a prompt that says your template was successfully created. You have now successfully created a Sage Intelligence standard report in Sage 300.
Don’t hesitate to reach out to our team today, if you have more questions about Sage Intelligence.
To get a quick overview of Sage Intelligence Reporting Services for Sage 300, view the video below:
Need help with your Sage 300 reporting? Contact Front Line Systems at 866-435-0243 today.
About Front Line Systems
Front Line Systems is a business technology consulting firm, with headquarters in Minneapolis, Minnesota. We are dedicated to helping businesses solve their accounting, manufacturing and warehouse concerns. We believe that your business has an amazing capacity for innovation and growth and that technology can help get you there.
Front Line Systems is a technology partner that solves problems and creates solutions for the life of your business. We provide CRM Software and CRM Consulting Services, ERP Software and other Business Technology solutions in Minnesota, Wisconsin, Virginia, DC, Maryland, Connecticut (New England)and serve clients across the US. Contact us at 866-435-0243 today.


Leave a Reply